Marketing Mix Modeling (MMM): The Complete 2026 Guide
What is Marketing Mix Modeling?
Marketing Mix Modeling is a statistical method, and one of the foundational techniques in marketing measurement and marketing analytics, that uses regression, most often multiple linear regression, to decompose sales into their underlying drivers: advertising investments, price, promotions, distribution, seasonality, and external factors. Increasingly, increasingly incorporate causal inference principles and forecasting techniques to move beyond simple correlation and estimate the incremental impact of each marketing lever and business driver.
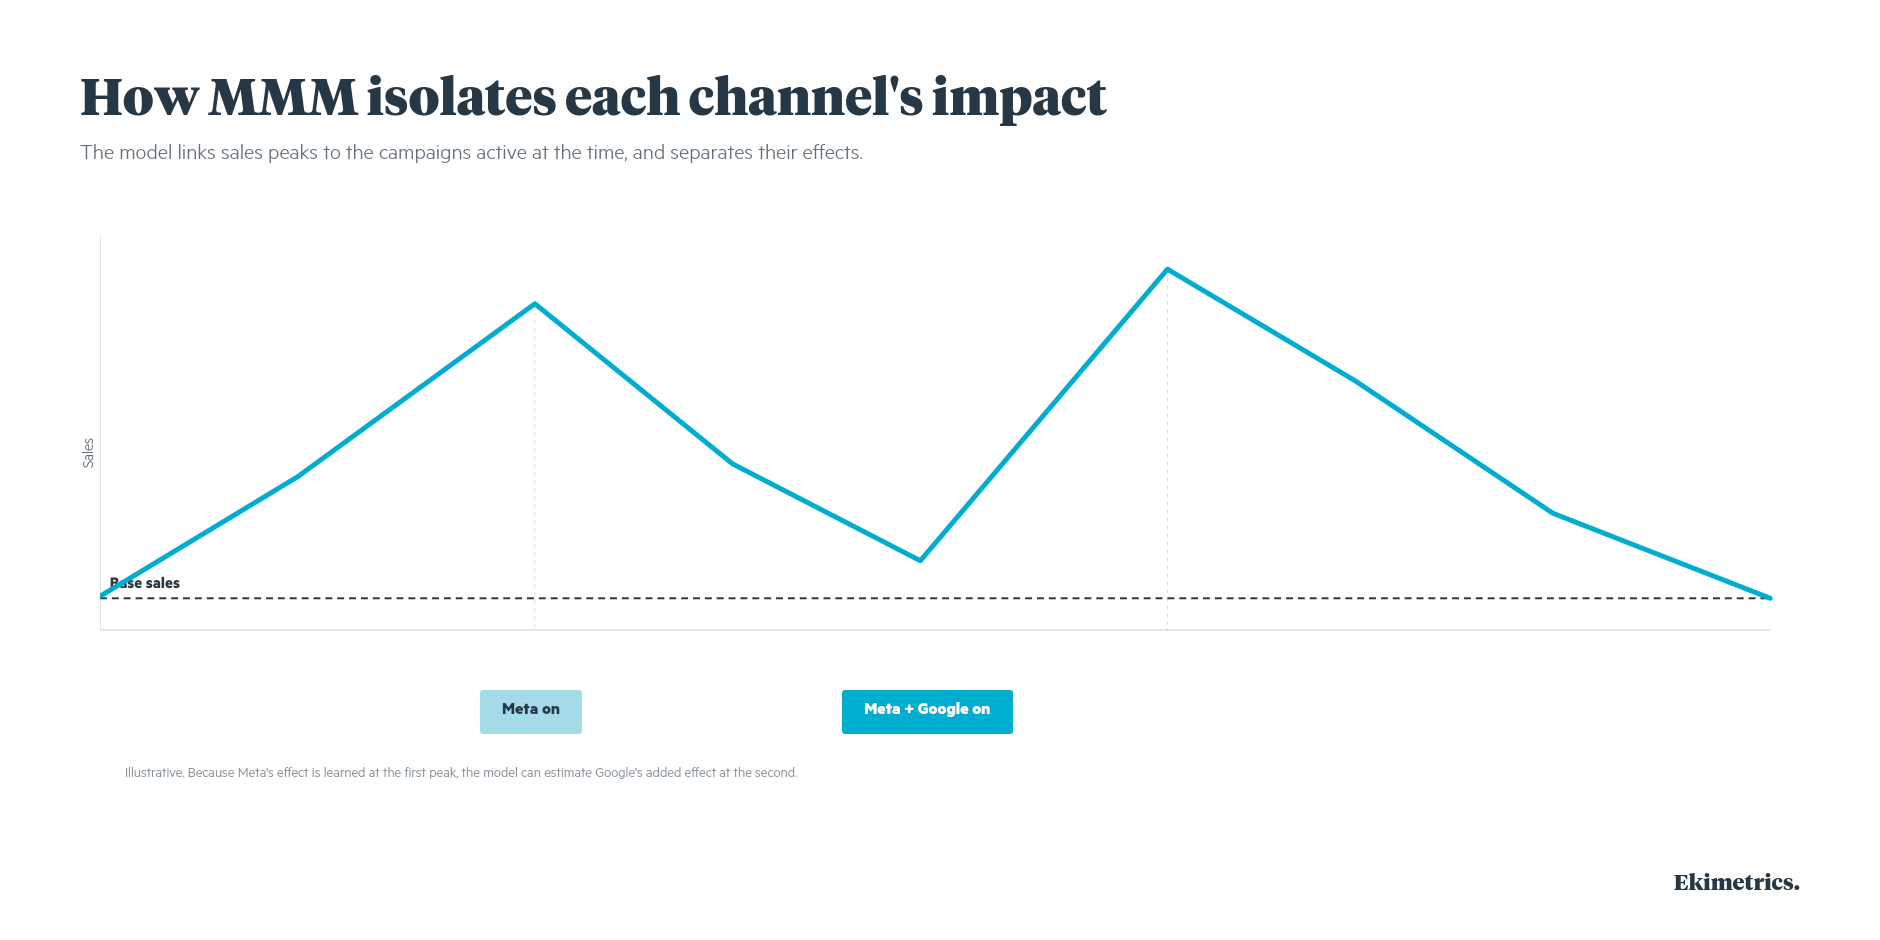
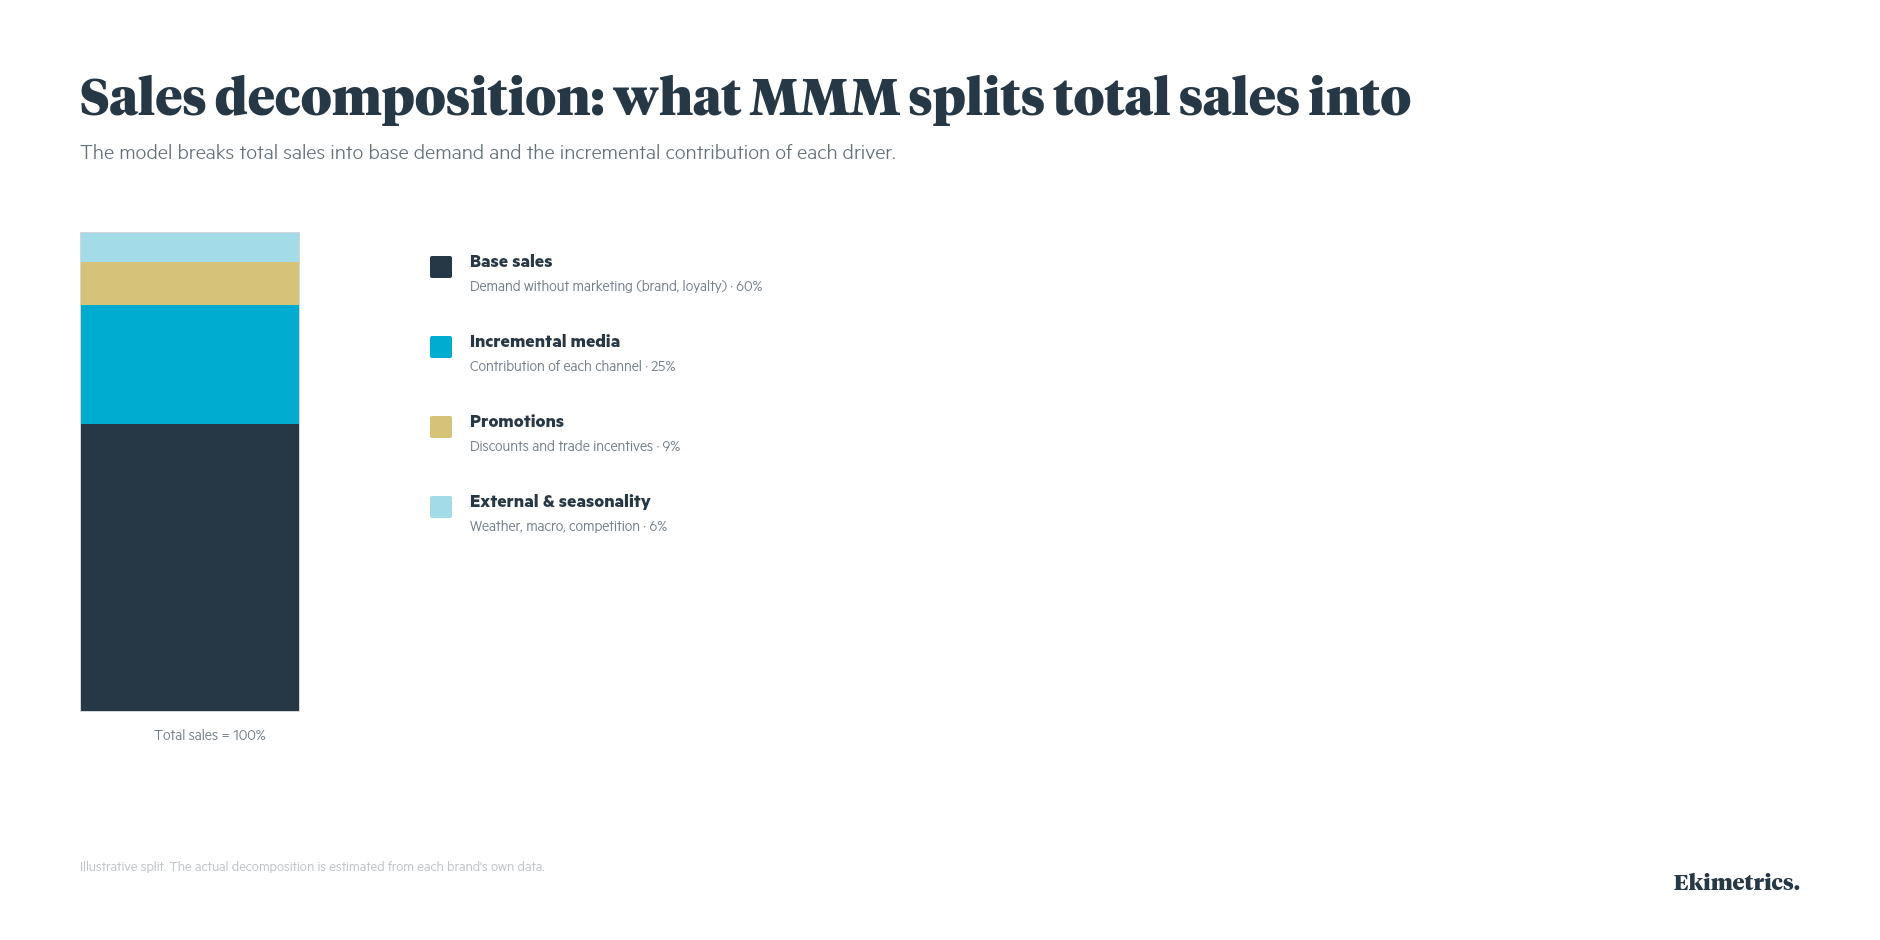
Two components sit at the core of any model. Base sales represent the organic demand that would occur without marketing activity, reflecting brand equity, distribution reach, and long-term loyalty. Incremental sales are the portion directly generated by marketing actions such as advertising, promotions, or price changes. Separating these two signals is what lets marketers distinguish long-term brand demand from short-term campaign impact.
Marketing Mix Modeling vs. media mix modeling
The two terms are often used interchangeably, but they describe different scopes. Media mix modeling focuses exclusively on paid media channels: TV, digital, search, social, or display. Marketing Mix Modeling takes the broader view, integrating the full set of commercial drivers: pricing, promotions and trade incentives, distribution and availability, competitive activity, macro-economic factors, and seasonality.
In other words, media is only one ingredient in the wider marketing mix. Because pricing changes, promotions, or distribution improvements can significantly influence the performance attributed to media, a media-only view risks crediting advertising with sales that would have happened anyway.
Adstock and carryover effects
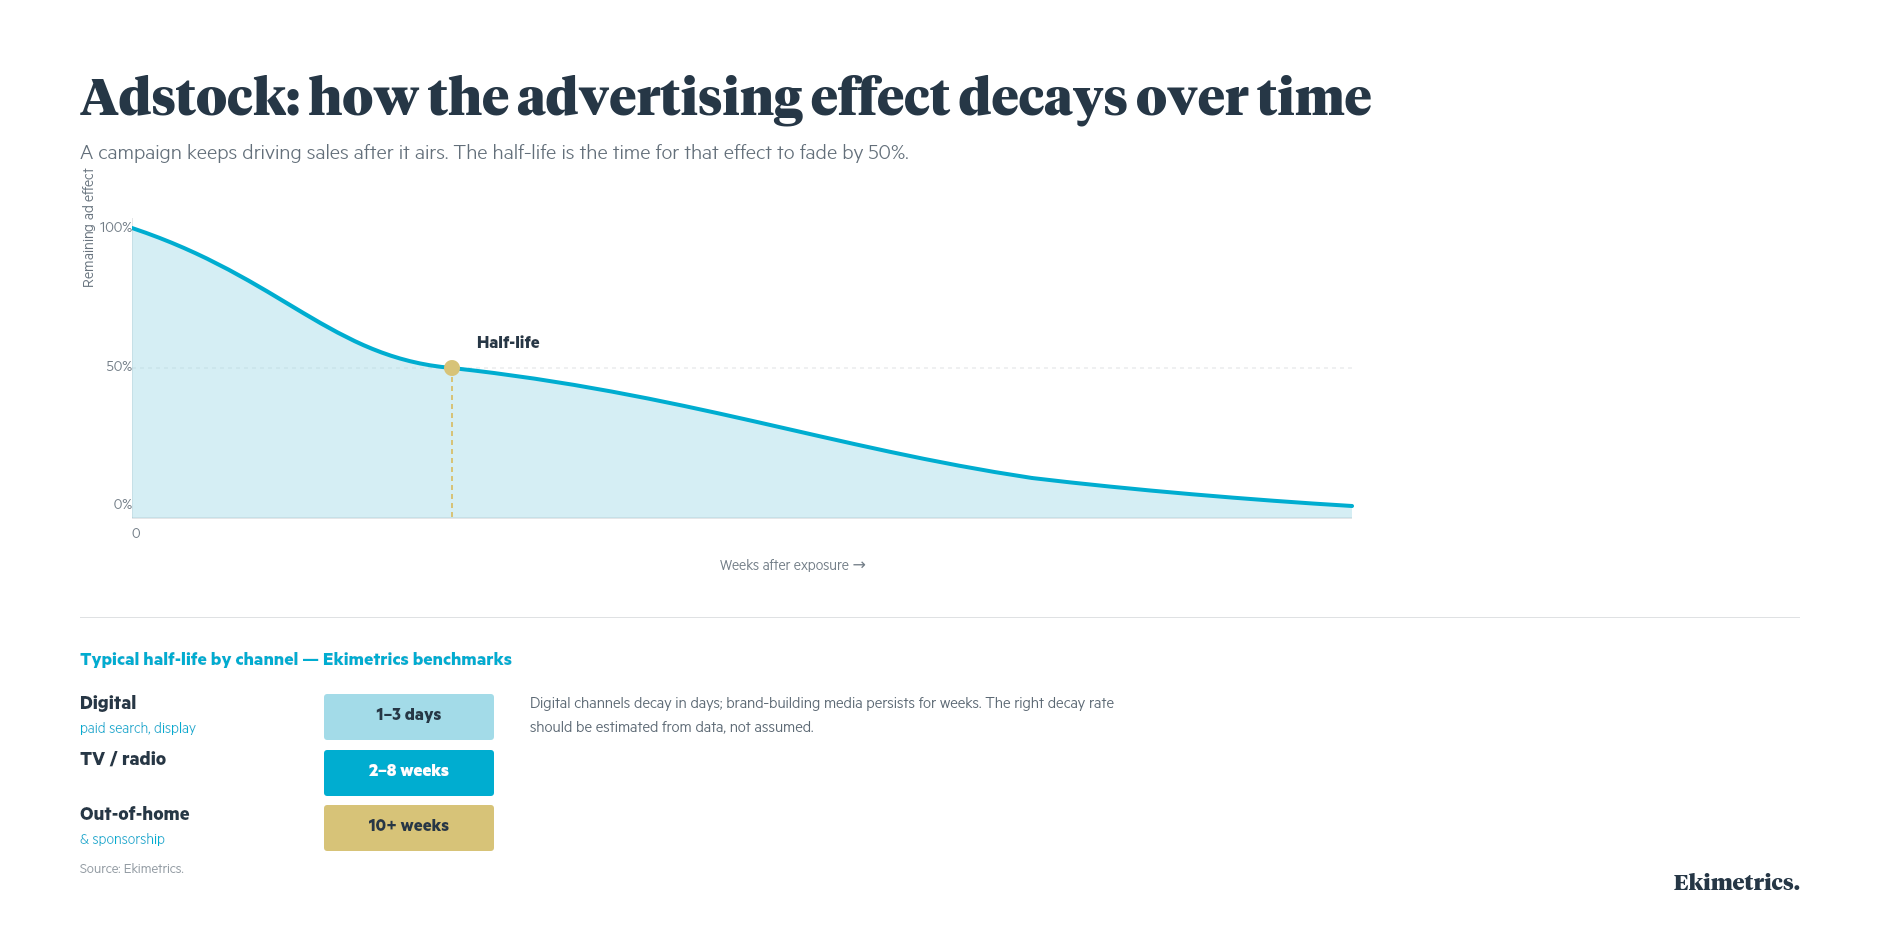
Adstock, also called advertising carryover, models the fact that a campaign keeps influencing purchases after it airs. Present in the large majority of marketing mix models, this effect typically extends over a few weeks to a few months. A TV spot running today can still generate sales several weeks later. Ignoring it leads the model to underestimate the true impact of advertising investment.
The half-life of adstock, the time it takes for the accumulated effect to fade by half, varies widely by channel. Digital channels such as paid search and display decay fast, with half-lives measured in days. TV and radio typically carry half-lives of a few weeks. Out-of-home and sponsorship, which build brand associations gradually, can persist for ten weeks or more. These are benchmarks, not fixed rules: the right decay rate should be estimated from data rather than assumed, since an incorrect adstock misattributes contribution across channels.
Saturation and diminishing returns
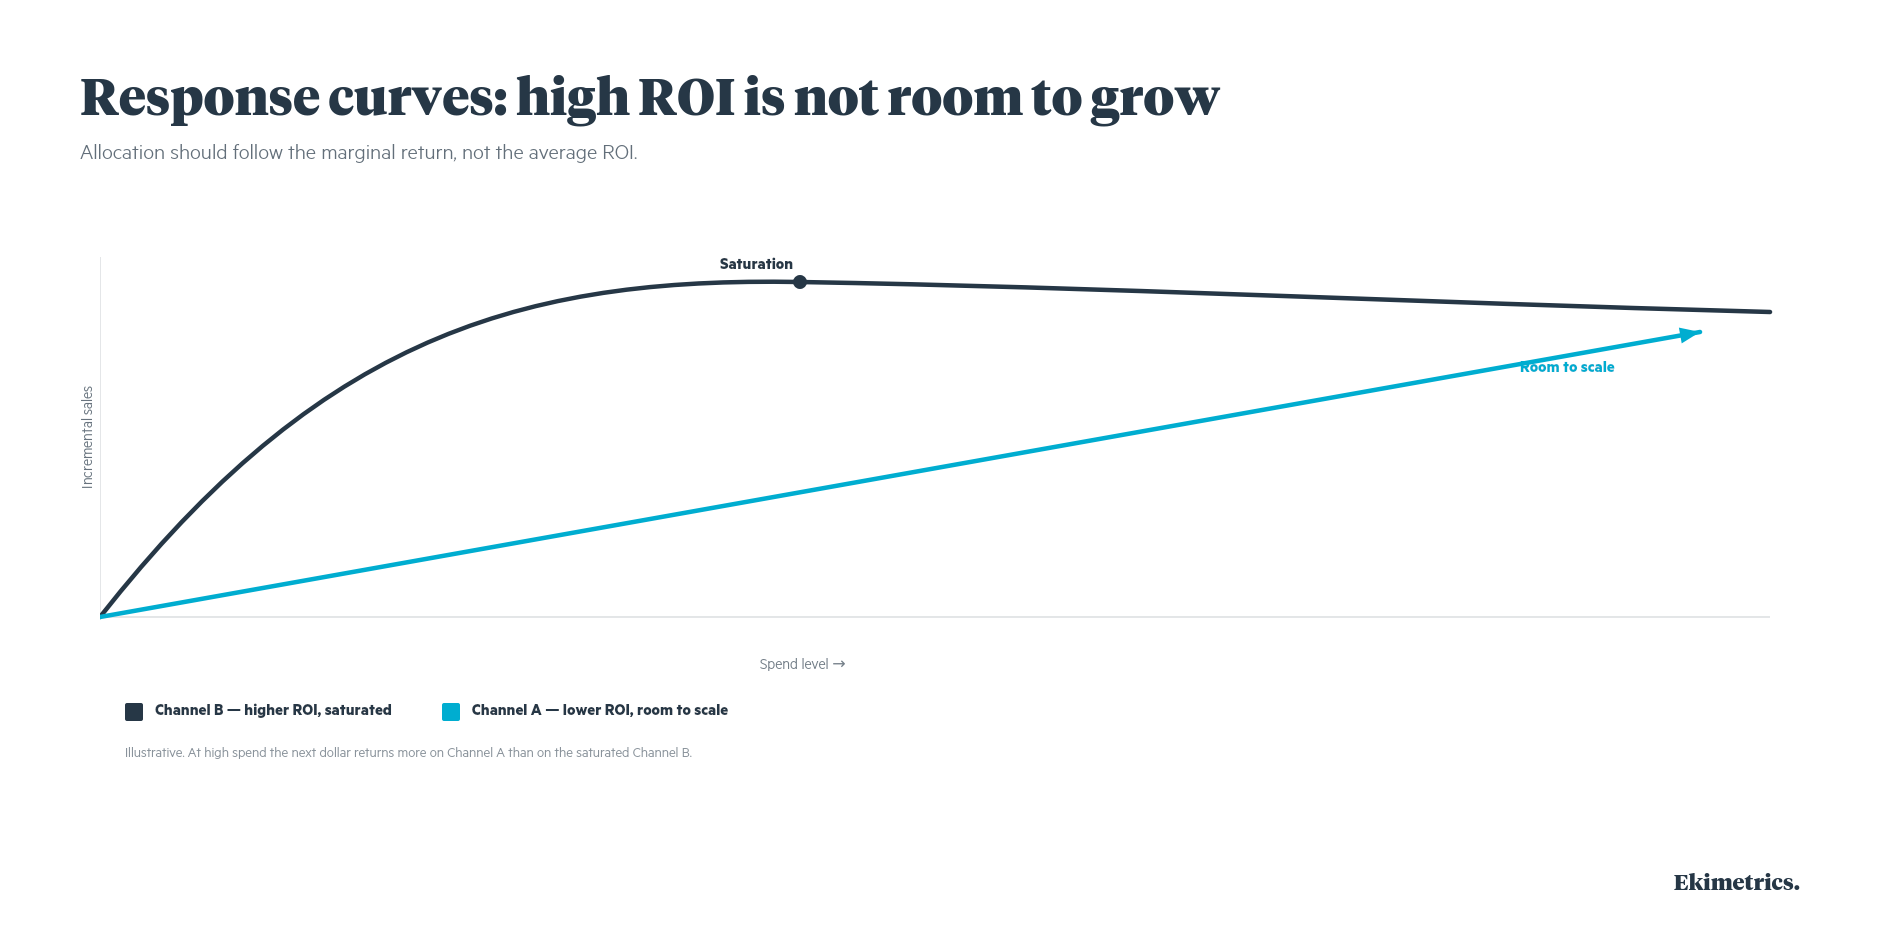
Marketing follows the law of diminishing returns: each additional dollar invested in a channel produces a progressively smaller return. Response curves illustrate this saturation effect, and marginal ROI (mROI) identifies the point at which a channel stops working efficiently. Two channels can have very different shapes: one with high ROI but heavy saturation, another with lower ROI but room to scale, which is why allocation decisions cannot rest on ROI alone.
Why MMM matters again in a privacy-first world
For years, marketing measurement leaned heavily on digital attribution, which tracks individual user journeys and assigns credit to touchpoints. That foundation is eroding. Cookie deprecation and stricter privacy regulation have made user-level tracking structurally less reliable. MMM uses no personal data. It analyzes aggregated time-series trends, which makes it naturally suited to a privacy-first environment.
Three shifts explain its return to the front line:
1. The end of easy tracking. Without cookies, the precision of digital attribution degrades structurally.
2. Fragmented customer journeys. Consumers move across digital, physical, and media environments. MMM captures the combined impact of all channels, including those that are hard to track individually such as TV, in-store promotions, or sponsorships.
3. The need for strategic allocation. What is the real ROAS by channel? Should budget shift toward TV or search? MMM answers these questions with data rather than assumptions.
In practice, Marketing Mix Modeling answers questions that classic attribution tools cannot:
- What was the real ROAS of each media channel over the last 12 months?
- What share of sales is driven by base demand rather than marketing?
- Did our trade promotions generate incremental revenue, or only pull forward future purchases?
- What happens if we move 10% of budget from social to TV?
How Marketing Mix Modeling works at a high level
At its core, MMM combines historical data across four types of inputs: marketing investments, commercial drivers (price, promotions, distribution), external factors (seasonality, macro trends), and the business outcome to explain, such as sales, revenue, or volume. Using multivariate regression, the model estimates how changes in each variable relate to variation in business performance, then the observed outcome into the contribution of each driver.
Sales, revenue, or volume is the dependent variable, the outcome the model aims to explain. Marketing activities and external factors are the independent variables that influence it. Careful model specification, control variables, and out-of-sample validation are what keep the results reliable and prevent the model from mistaking correlation for contribution.
MMM vs. Multi-Touch Attribution (MTA): which approach to choose?
The Marketing Mix Modeling versus attribution debate comes up often. In reality the two approaches answer different questions and complement each other rather than compete.
MTA optimizes day-to-day campaign execution. MMM guides medium and long-term investment decisions. MMM does not replace attribution; it gives it the strategic context it lacks. (See more about MMM vs. MTA here)
.png)
To go deeper on how the two work together, see our white paper The New World of Marketing Measurement.
How to run a Marketing Mix Modeling project
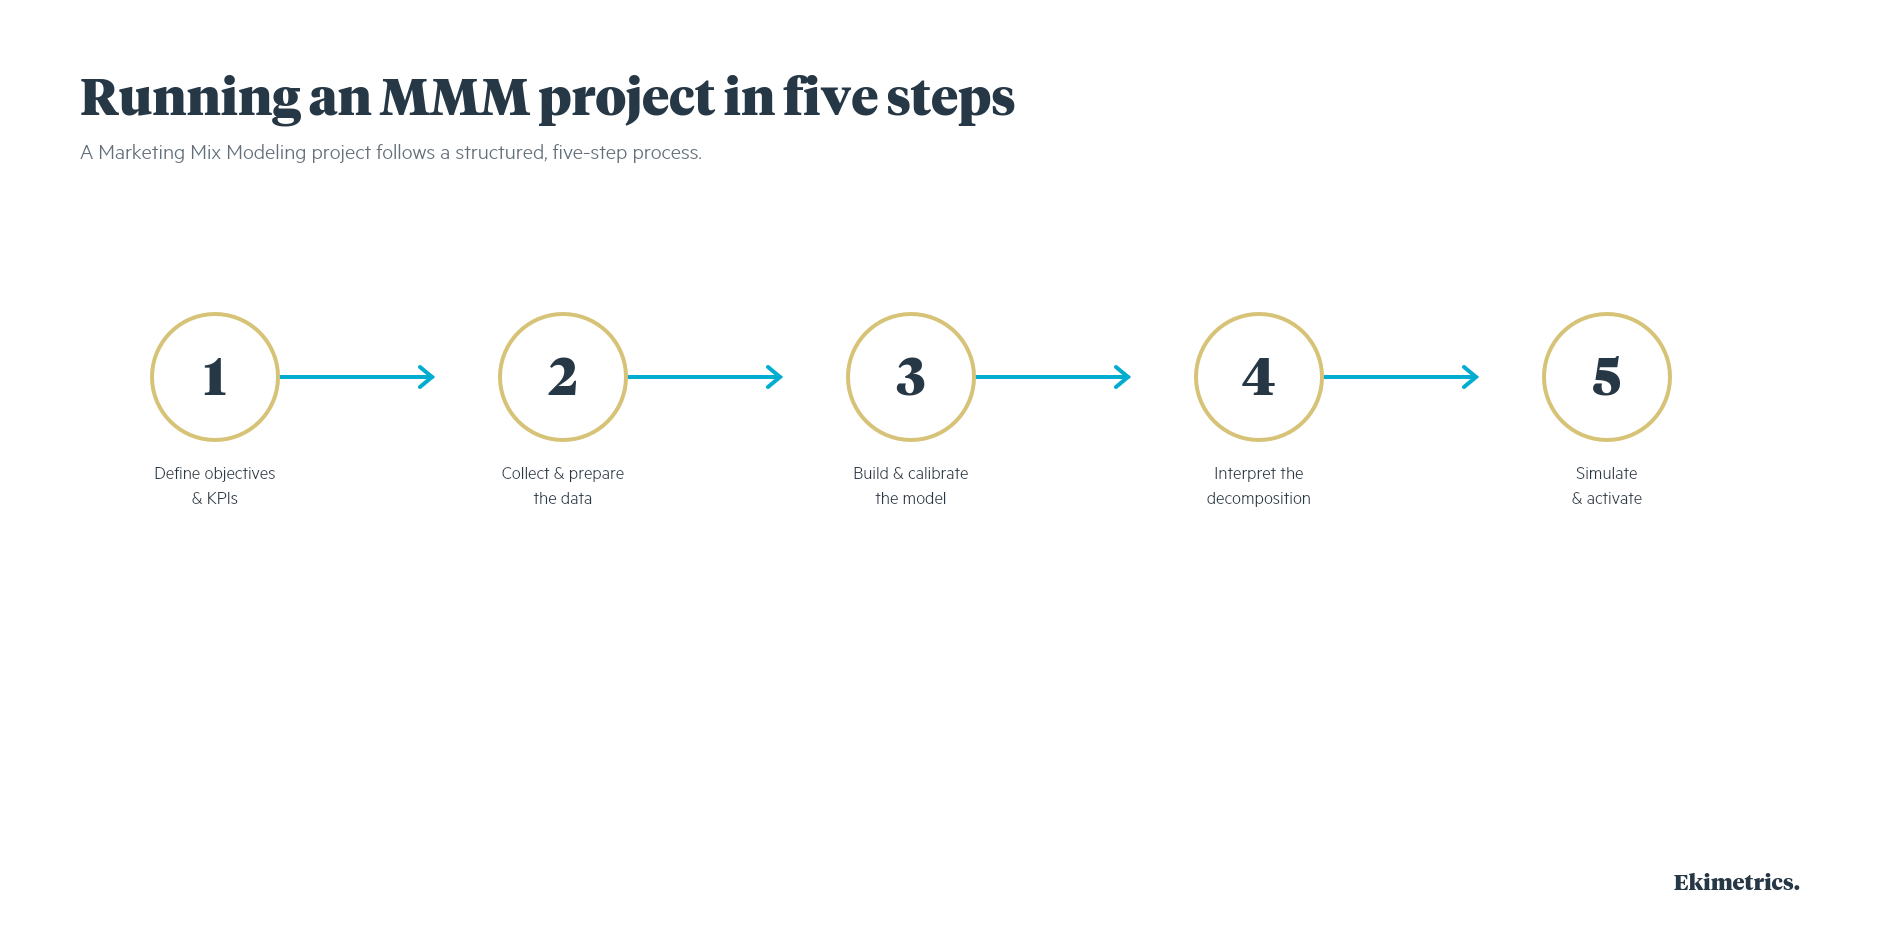
A Marketing Mix Modeling project follows a structured, five-step process. Across more than 15 markets deployed, the rigor applied at each step directly conditions the quality of the decisions that follow.
1. Define objectives and KPIs. Identify the priority business questions, whether that is media ROI by channel, promotional impact, or sales forecasting.
2. Collect and prepare the data. Audit all available sources: sales, marketing data (spend, impressions, GRPs), price, promotions, and exogenous variables. Three years of weekly history is the commonly accepted threshold.
3. Build and calibrate the model. Choose between a frequentist approach (classic regression) and a Bayesian one (using frameworks such as PyMC) depending on data volume and market complexity.
4. Interpret the sales decomposition. Attribute each variation to its drivers: base sales, media contribution by channel, promotions, and seasonality.
5. Simulate scenarios and activate. Test different budget allocations virtually before committing, using scenario simulation.
Many organizations start with a pilot scope, one market, one brand, or a limited set of channels, before scaling across the marketing organization.
What data do you need for a reliable MMM?
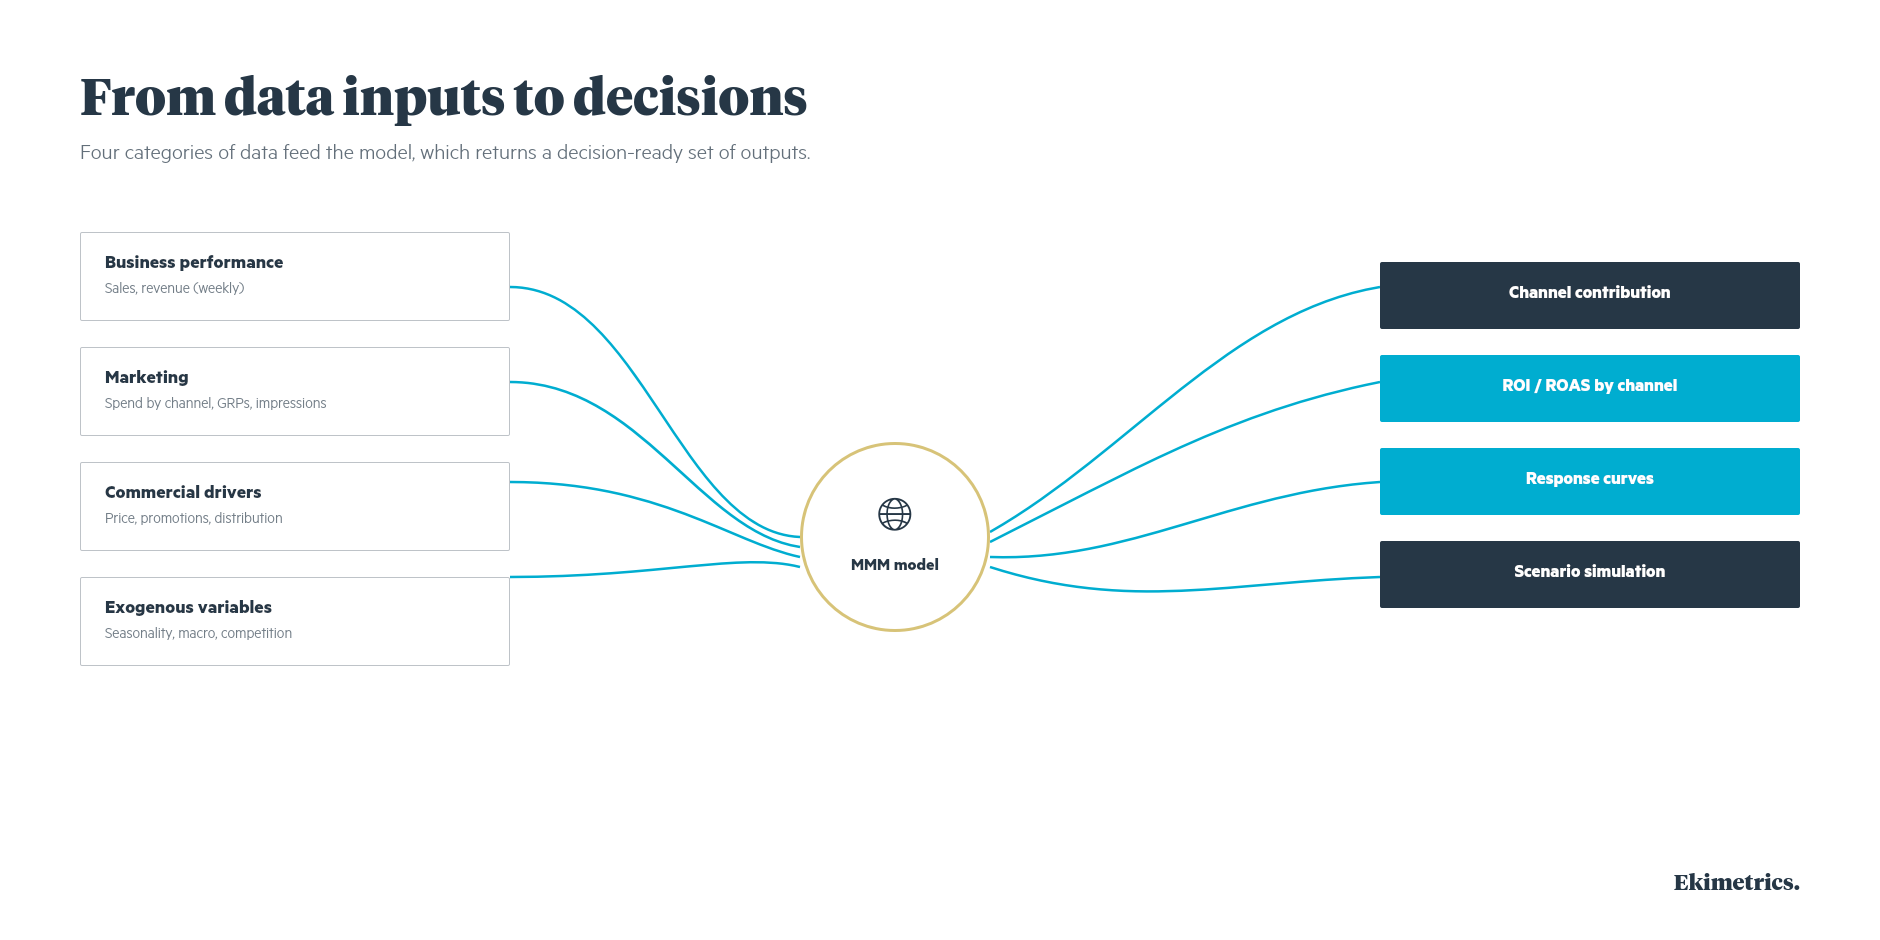
The reliability of a marketing mix model depends directly on input data quality. Four categories are typically required:
1. Business performance data: sales or revenue, ideally at weekly granularity.
2. Marketing data: spend by channel (TV, digital, search, social, display), with impressions or GRPs where available.
3. Commercial drivers: price, promotions, distribution coverage.
4. Exogenous variables: seasonality, macro-economic indicators, competitive activity.
Temporal alignment across all sources is essential. A missing or poorly documented data point, such as an untracked price change or a stock-out, can distort the entire set of attributions and lead to flawed investment decisions. Careful data preparation is usually the most time-consuming step in model development.
What are the limitations of MMM?
Like any statistical model, Marketing Mix Modeling carries methodological constraints worth knowing before interpreting results. Three challenges recur:
- Endogeneity. Marketing spend often rises when demand is already strong. Without an appropriate control variable, the model may credit marketing with growth that would have happened anyway.
- Omitted variables. A driver missing from the model has its effect absorbed by the available variables, which distorts the full set of attributions.
- Correlated spend. Channels often move together. When TV, digital, and search increase at the same time, isolating each lever's individual impact becomes harder.
These biases are identifiable and manageable through robust control variables, regularization techniques, out-of-sample validation, and triangulation with field experiments.
Typical outputs of a marketing mix model
Once a model is built and validated, Marketing Mix Modeling produces a set of outputs that explain what actually drove performance. Three are central to reading any model:
- Channel contribution. The model decomposes total sales into the estimated impact of each driver: media channels, price, promotions, distribution, seasonality, and external factors. This gives a clear view of what contributed to results over a given period.
- ROI and return on ad spend (ROAS). For each channel, the model estimates how efficiently investment generated incremental revenue, including marginal ROI, the expected return on the next unit of spend.
- Response curves. These show how sales respond to different levels of investment, revealing the diminishing returns and saturation effects discussed above.
A further capability is scenario simulation. Using response curves and historical performance, teams can test different allocations virtually before committing, which turns MMM from a retrospective report into a forward-looking decision tool. These outputs are best read directionally rather than as precise predictions; their value lies in relative impact.
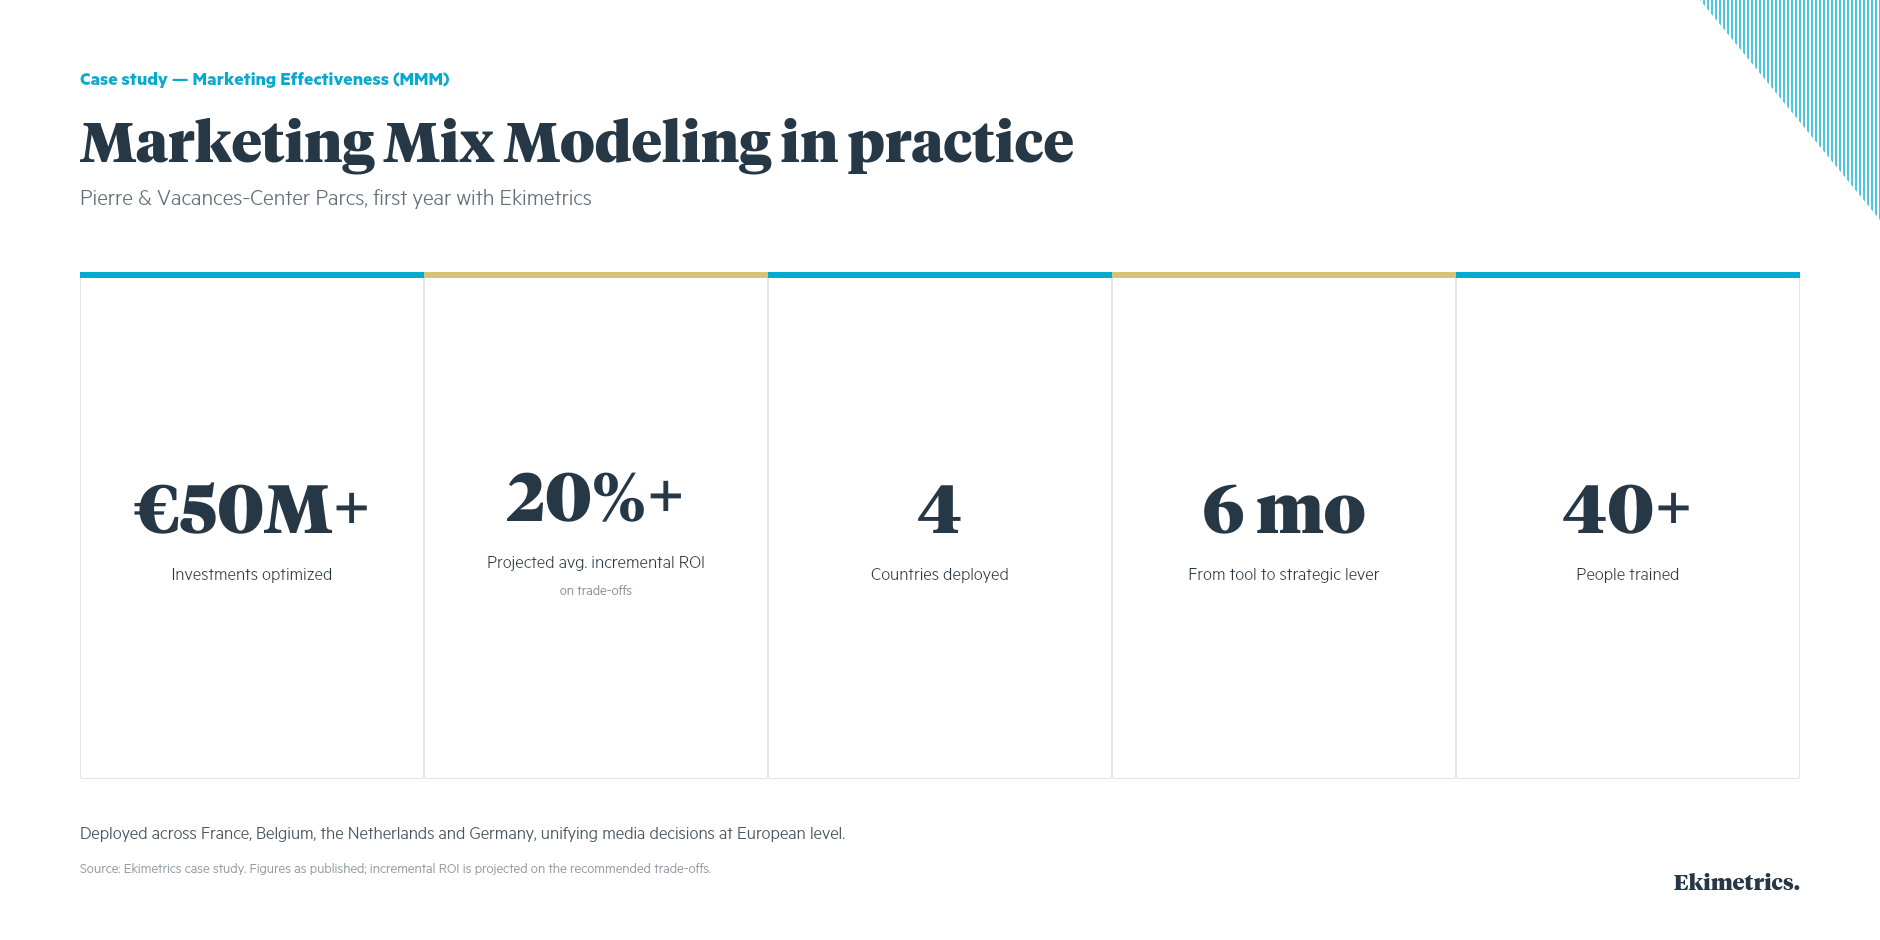
A good illustration comes from Pierre & Vacances-Center Parcs, which deployed MMM with Ekimetrics across five European markets to build a shared view of marketing performance. In the first year, the group optimized over 50 million euros of investment, with a projected average incremental ROI above 20% on the recommended trade-offs, and moved from a management tool to a strategic lever in six months. To see how these outputs are produced and activated at scale, explore our Marketing Effectiveness solution and the Eki.Decisions platform.